ES Weekly Outlook, Nov 9 to 13: Support at 7,307 to 7,325 After the Drop
Trading Education ·

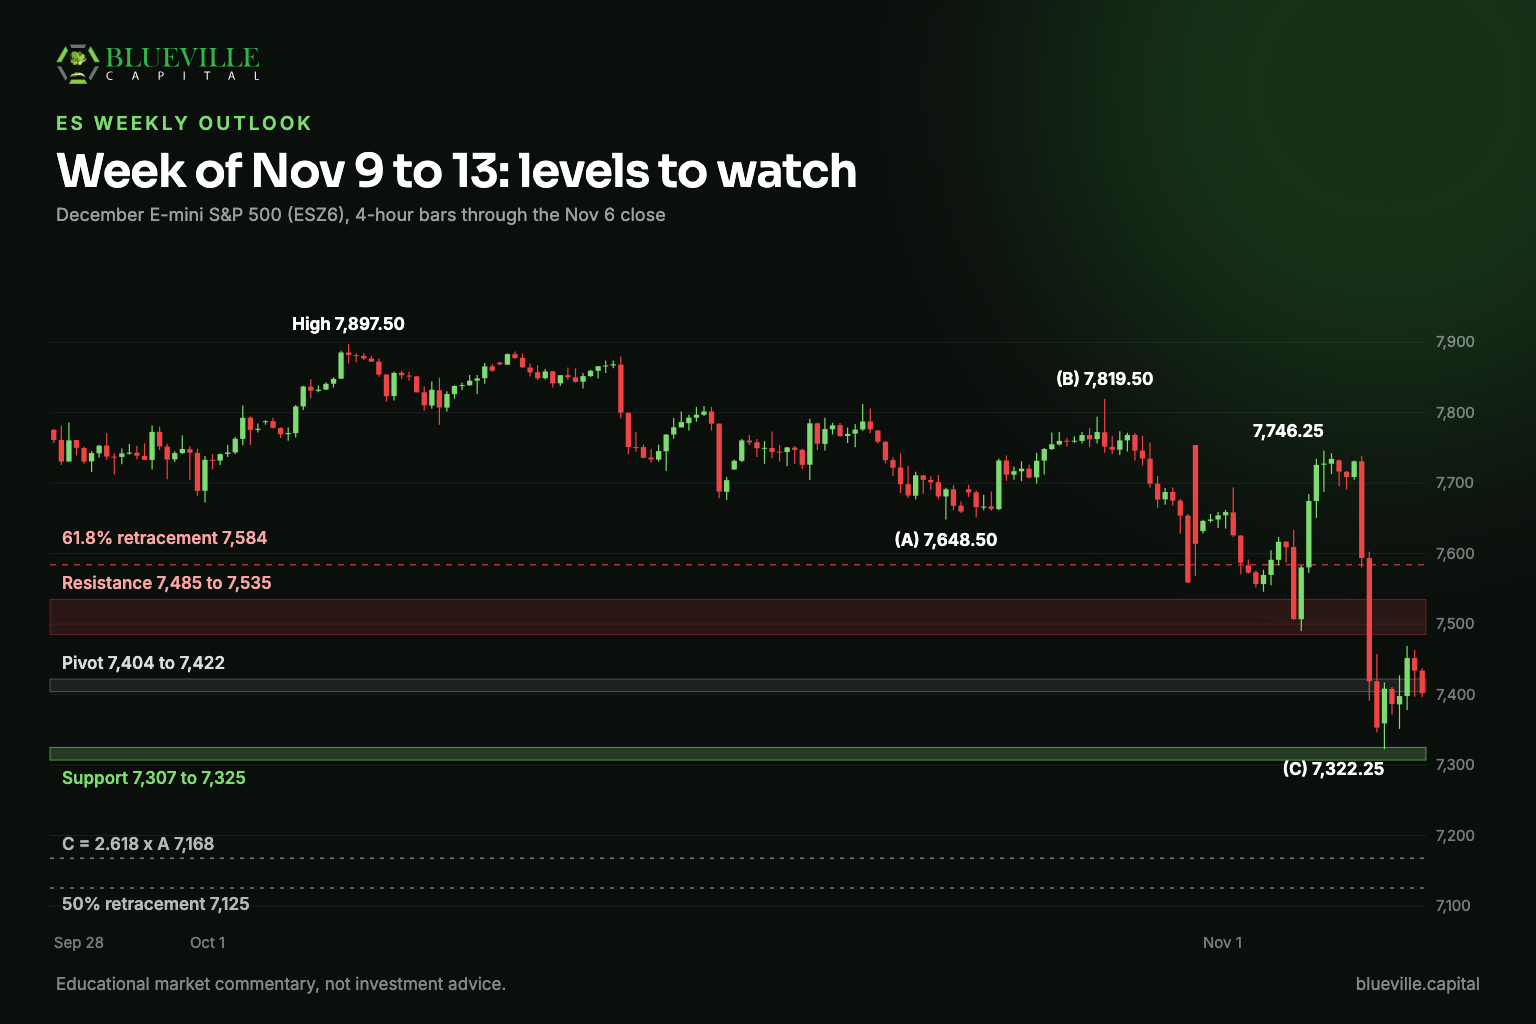
For the week of November 9 to 13, the December E-mini S&P 500 (ES) starts just above major support at 7,307 to 7,325, after Thursday’s drop from 7,746.25 to 7,322.25. Our primary scenario is a relief bounce toward 7,485 to 7,535 as long as 7,322 holds. A break below 7,307 shifts the focus to 7,168 and then 7,125.
This is Blueville’s weekly ES outlook: the structure, the levels and the two scenarios we are watching, built from the daily, 4-hour and 65-minute charts. It is market commentary, not a trade recommendation. Next Sunday’s outlook will start by checking these levels against what ES actually did, hits and misses alike.
Where ES Stands Going Into the Week
The bigger picture is a long rally followed by a correction. ES climbed from a swing low of 6,353.25 on March 31 to an all-time high of 7,897.50 on October 6. Since that high, the market has been working lower in a three-part corrective pattern.
The latest leg was fast. ES reached 7,746.25 on Wednesday, November 4, then fell more than 400 points in about a day, touching 7,322.25 on Thursday evening. Friday held above that low, set a higher low at 7,351.25 overnight, and closed the week near 7,404. Prices here are from the December contract, which trades on CME Globex.
The Elliott Wave Count: A-B-C From the High
Elliott Wave analysis labels market swings as waves. A correction after a strong rally often unfolds in three parts: a first decline (A), a partial bounce (B), and a second decline (C). The labels are an interpretation, not a fact, so we lean on the price levels more than on the names.
- Wave (A): 7,897.50 on October 6 down to 7,648.50 on October 23, a drop of 249 points.
- Wave (B): a choppy bounce to 7,819.50 on October 28, which failed below the high.
- Wave (C): the decline from 7,819.50, including the lower high at 7,746.25 and Thursday’s selloff to 7,322.25.
One measurement stands out. When wave C runs twice the length of wave A, it ends at 7,321.50. The actual low, 7,322.25, came within a point of that.
On the intraday charts, the drop from 7,746.25 to 7,322.25 reads as a complete first leg down. The two lows at 7,322.25 and 7,351.25 form a double bottom. On the 65-minute chart, the MACD histogram shows bullish divergence and the Stochastic RSI is curling up from oversold. Together these suggest the short-term selling is tired and a counter-trend bounce is starting. They do not say the correction is over.
Support: Why 7,307 to 7,325 Matters
Several independent measurements cluster in one 18-point band. That kind of overlap is what makes a support zone worth watching.
| Level | What it is |
|---|---|
| 7,324.00 | The July 29 swing low, the last major pivot before the run to the high |
| 7,322.25 | Thursday’s low |
| 7,321.50 | Wave C at twice the length of wave A |
| 7,307.50 | The 38.2% retracement of the whole rally from 6,353.25 to 7,897.50 |
Below this zone, the deeper retracements of the same rally sit at 7,125.50 (50%) and 6,943.25 (61.8%).
Resistance If a Bounce Develops
If buyers step in, the first targets are the retracements of the fall from 7,746.25 to 7,322.25:
| Retracement | Level | Notes |
|---|---|---|
| 23.6% | 7,422.25 | The week’s pivot. Friday closed just below it. |
| 38.2% | 7,484.25 | Near the old support shelf from early November |
| 50% | 7,534.25 | Lines up with the falling 4-hour 21-period moving averages, around 7,525 to 7,560 |
| 61.8% | 7,584.25 | The broken 4-hour structure where Thursday’s drop accelerated |
Two Scenarios for the Week
| Scenario | What would confirm it | Levels in play | What would cancel it |
|---|---|---|---|
| Relief rally (primary) | Price holds above 7,322 to 7,350 and stays above the 65-minute 21-period average near 7,404 | A close above 7,422 opens 7,485 to 7,535. The intraday base at 7,351 is the first support. | A break below 7,322 |
| Trend continuation (secondary) | Rallies stall below 7,450 and price breaks 7,322 to 7,307 | Bounces capped near 7,422. Downside to 7,168 (wave C at 2.618 times wave A), then 7,125 (the 50% retracement). | A move back above 7,585 |
The week’s pivot is 7,404 to 7,422. Above it, the path of least resistance is the relief rally toward the 4-hour moving averages. We expect sellers to defend 7,535 to 7,584, where the 61.8% retracement, the moving averages and the broken structure meet. A rally that fails there leaves the broader correction intact.
Event Risk: CPI on Tuesday
The October Consumer Price Index comes out on Tuesday, November 10, at 8:30 a.m. ET, according to the Bureau of Labor Statistics release schedule. A surprise in either direction can carry ES through a level before anyone can react. If you trade around the number, read how CPI and jobs reports move ES and NQ futures first.
How to Use These Levels
Treat each level as a zone, not a line. Watch how price behaves when it gets there: a quick rejection says something different from a slow grind through. ES also trades nearly around the clock, so some of these tests may happen overnight; our guide to trading the ES and NQ overnight session covers what changes after the cash close.
Decide your exit before you enter. Each ES point is worth $50 per contract and $5 on the micro (MES), as our futures tick value guide explains. The futures position size calculator shows how many contracts fit a given stop and risk budget.
FAQs
What is the ES weekly outlook?
It is a Sunday note on the E-mini S&P 500 futures: the chart structure, the support and resistance levels, and the scenarios for the week ahead. Each new outlook starts by grading the previous week’s levels against what actually happened.
What does “what would cancel it” mean in the scenarios?
It is the price that would prove the scenario wrong. If ES breaks below 7,322, the relief rally case no longer holds, whatever happened before. Knowing that level in advance keeps you from holding onto a view the market has already rejected.
Is this a trade recommendation?
No. It is educational market commentary for a general audience. It does not consider your goals, account size or risk tolerance, and nothing in it tells you to buy or sell.
Why follow ES instead of the S&P 500 index?
ES trades from Sunday evening to Friday afternoon with short daily breaks, so its levels apply from the Sunday open. The S&P 500 index itself only prices during the regular session. ES and SPX usually move together, but the futures price includes a small premium or discount to the index.
Conclusion
ES goes into the week sitting on its most important support since the October high. Above 7,322, a relief bounce toward 7,485 to 7,535 is the primary case, with 7,404 to 7,422 as the pivot. Below 7,307, the correction likely extends toward 7,168 and 7,125. CPI on Tuesday morning is the obvious wild card.
To trade these sessions with live alerts, setup reviews and text support during the overnight and morning sessions, see the Futures Add-On on our Services page.
Educational market commentary only, not investment advice or a recommendation to buy or sell any security or futures contract. Futures trading involves substantial risk of loss and is not suitable for every investor. Levels are from the December E-mini S&P 500 contract, with swing points before September taken from the front-month contract at the time, and may differ slightly on other data feeds. Blueville Capital LLC is not a registered broker or financial advisor.
Free weekly email
Every alert, every Friday
The Weekly Alert Report: every alert we sent that week, winners and losers, with the high each one reached.