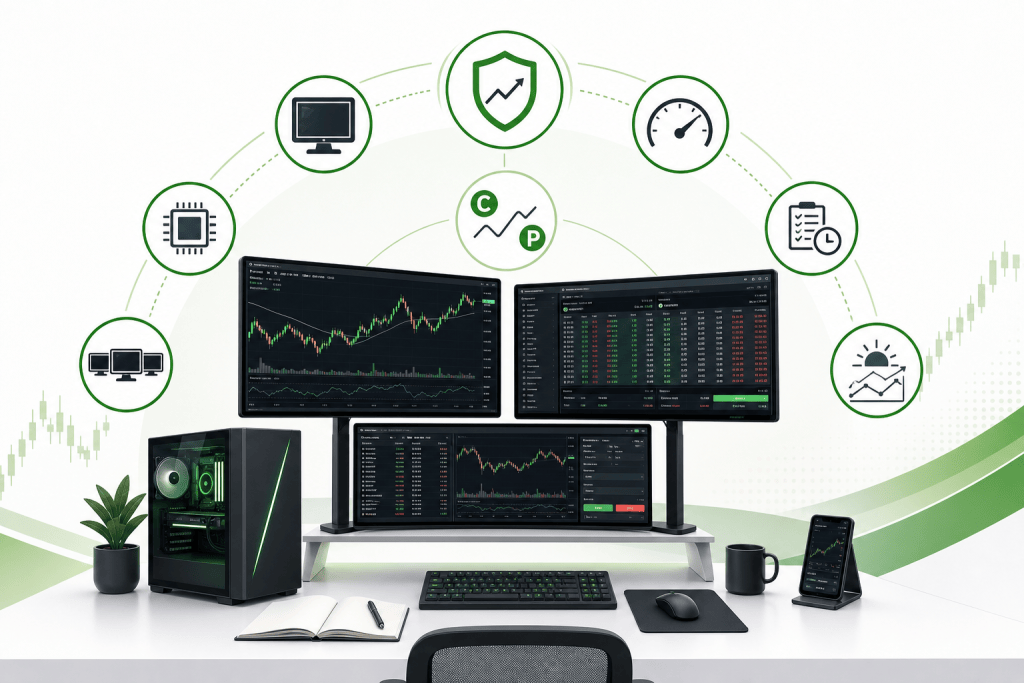
Most retail traders watch price. Institutional traders watch flow.
That gap — between reacting to price and understanding the orders driving it — separates consistent traders from everyone else. Options flow gives you a window into what large players are actually doing, not just what the chart looks like after the fact.
This guide breaks down how to read options flow, what unusual activity actually means, how dark pool prints factor in, and how to use all of it to make smarter trading decisions — especially if you're trading SPX, SPY, RUT, or IWM options.
What Is Options Flow?
Options flow is the real-time stream of options transactions happening across exchanges. Every time a trader buys or sells a contract, that transaction becomes part of the flow. When you aggregate those transactions and look for patterns — particularly large or unusual ones — you start to see where significant money is being positioned.
Big money leaves footprints. A hedge fund or institutional desk moving into a position can't hide it entirely. They execute through the same market infrastructure everyone else uses, and that execution shows up in the tape.
Options flow analysis is reading those footprints and using them to inform your own trades.
Why Options Flow Matters More Than Just Watching Price
Price action tells you what happened. Options flow gives you clues about what might happen next.
When a large institution buys 5,000 call contracts on SPY expiring in two weeks, they're not doing it on a whim. That's a deliberate, sized bet with real capital behind it. If you can spot that activity early — before the underlying moves — you have an informational edge.
This is why options order flow trading has become serious discipline among active retail traders. It's not about copying every big trade blindly. It's about building context. Understanding whether the market is being positioned bullishly or bearishly at a macro level, then aligning your own setups accordingly.
The Key Components of Options Flow
1. Premium Spent
The most important signal in any options flow print isn't the number of contracts — it's the total premium exchanged. A trade involving 100 contracts at $50 premium each is $500,000 in notional value. That's meaningful. A trade involving 1,000 contracts at $0.05 is $5,000. Not so much.
When scanning flow, filter by premium size. Trades above $100,000 in premium start to get interesting. Trades above $500,000 or $1 million are worth paying close attention to.
2. Expiration Date
Short-dated options (weekly or 0DTE) carry different implications than longer-dated positions. A large buy of 0DTE SPX calls is likely a directional intraday bet. A large buy of calls expiring 60–90 days out suggests a more strategic, longer-term position — possibly a hedge or a macro directional play.
Expiration tells you the time horizon of the bet. That context matters when interpreting intent.
3. Strike Selection
Where the strike sits relative to the current price reveals a lot. Deep in-the-money options behave more like stock and are often used for hedging or synthetic exposure. At-the-money options are pure directional bets. Far out-of-the-money options, when bought in size, are either cheap lottery tickets or a sign that someone expects a significant move.
Unusual activity in OTM options — especially when premium is large — tends to get the most attention in flow analysis circles, and for good reason.
4. Buy Side vs. Sell Side
This is where flow analysis gets nuanced. When you see a large options print, you need to determine whether it was a buy or a sell — and that's not always obvious from the raw data.
The standard method is to look at whether the trade hit the ask (bought) or the bid (sold). A trade that executes at or above the ask is considered a buy-side print, meaning someone was aggressive enough to pay up. A trade at the bid suggests selling. Most flow scanners will flag this for you, but it's worth understanding the logic behind it.
5. Sweeps vs. Blocks
A block is a single large transaction, often negotiated off-exchange and printed at once. A sweep is when a large order is broken up and executed aggressively across multiple exchanges simultaneously — the buyer is in a hurry and doesn't want to wait for liquidity.
Sweeps tend to be stronger bullish or bearish signals than blocks, because the aggression behind them suggests urgency. When you see a sweep on SPX calls, someone wanted in fast.
Understanding Unusual Options Activity
Unusual options activity (UOA) is flagged when the volume of contracts traded on a particular strike and expiration significantly exceeds the open interest. In plain terms: more people are trading this contract than have ever held it before.
This is a signal worth investigating. It doesn't mean the trade is always right — institutions hedge, they make mistakes, and sometimes large prints are part of complex multi-leg strategies that look directional but aren't. But when UOA appears in a name or index you're watching, it's worth understanding what's happening.
How to Evaluate Unusual Activity
Ask these questions when you spot unusual options activity:
- Is this a new position or a close? If open interest rises the next day, it was a new position. If it stays flat or drops, it may have been a close.
- Is it a single strike or spread across multiple strikes? Multi-leg activity often signals hedging. Single-strike conviction buys are more directional.
- Does it align with the broader tape? UOA that runs counter to price action can be especially significant — large buyers stepping in while price is falling, for example.
- Is there a catalyst nearby? Earnings, Fed decisions, economic data releases — unusual activity ahead of known events needs to be discounted slightly, because it may simply reflect event hedging.
Dark Pool Prints and What They Mean
Dark pools are private exchanges where large institutional orders are executed away from the public market. They exist to allow big players to move large positions without causing price impact. The trades still get reported — they just don't show up in real-time order books.
Dark pool prints in the options context refer to large off-exchange transactions that are later reported to the tape. When you see a significant dark pool print on an index like SPY or IWM, it usually means a major institution has moved a substantial position.
What to Look For
Dark pool activity is most useful when:
- The size is unusually large relative to average daily volume
- The print clusters near a key technical level — institutions often use supply and demand zones to enter or exit
- Multiple prints appear in the same direction over a short period — this suggests accumulation or distribution, not a one-off hedge
Dark pool data alone isn't a trading signal. It becomes useful when combined with price structure, options flow, and market context. Think of it as confirmation, not a trigger.
How Institutional Options Flow Informs Retail Trading Decisions
Here's the practical part. You've spotted a large sweep on SPX calls. Premium is $800,000. Strike is slightly OTM. Expiration is 10 days out. It hit the ask. What do you do?
You don't blindly follow it. Instead, you use it as a data point to build a thesis.
A Simple Framework for Using Flow
Step 1: Note the direction and conviction
Large premium, aggressive execution (sweep, ask-side) = high conviction directional bet. Small premium, block print = less clear.
Step 2: Check the broader flow context
Is this an isolated print, or are you seeing multiple large call buys across different expirations? Consistent directional flow across the tape is more meaningful than a single outlier.
Step 3: Align with price structure
This is where supply and demand analysis comes in. If you're seeing bullish flow and price is sitting at a major demand zone, those two signals together are far more compelling than either one alone. The flow tells you someone big thinks price is going up. The structure tells you where the logical entry is.
Step 4: Define your setup
Flow gives you a directional bias. Your technical analysis gives you an entry. Your risk management gives you a position size and exit. All three need to work together.
Step 5: Manage the trade, not the narrative
Once you're in, manage the trade on its own merits. Institutional flow doesn't guarantee anything. Markets are complex, and big players are wrong too. Your job is to take high-probability setups and manage risk — not to follow institutions off a cliff.
Common Mistakes Retail Traders Make With Flow Data
Chasing Prints Without Context
Seeing a big print and immediately buying the same contract is one of the fastest ways to lose money. By the time the print hits your scanner, the entry price may already be gone. Worse, you might be buying what an institution is selling to close.
Ignoring Hedging Activity
Not every large options print is a directional bet. Portfolio managers hedge constantly. A large put buy on SPY might be a hedge against a long equity portfolio, not a bearish call on the market. Context matters.
Over-relying on Flow at the Expense of Structure
Flow tells you intent. Structure tells you where. You need both. Some traders get so caught up in flow data that they forget to look at whether price is at a logical entry point. Buying a call because of flow when price is at major resistance is still a bad trade.
Treating Every Unusual Print as a Signal
Scanners surface a lot of data. Not all of it is meaningful. Develop a filtering process — minimum premium thresholds, sweep-only filters, index focus — so you're looking at the highest-quality signals rather than drowning in noise.
Applying This to SPX and Index Options Trading
For traders focused on SPX, SPY, RUT, and IWM — which tend to be the most liquid and heavily traded options markets — flow analysis is particularly powerful.
These indices attract enormous institutional participation. Hedge funds, pension managers, and market makers are all active in these markets daily. That means the flow data is rich, the signals are more reliable, and the connection between large prints and subsequent price moves is more consistent than in individual stocks.
When you combine institutional options flow with supply and demand levels on SPX or SPY, you're working with two of the most powerful analytical tools available to retail traders. Flow gives you directional context. Supply and demand gives you precise entry and exit points.
This combination — reading the flow, identifying the structure, executing with discipline — is the foundation of how serious options traders approach the market every day.
Tools for Reading Options Flow
There are several platforms designed specifically for options flow analysis:
- Unusual Whales — Popular flow scanner with filtering options and dark pool data
- Cheddar Flow — Real-time flow alerts with sweep tagging
- Market Chameleon — Good for historical flow comparison and open interest tracking
- Flowalgo — Institutional-grade flow with alerts and sector breakdown
- Thinkorswim (TD Ameritrade/Schwab) — Built-in options chain data and volume analysis
Most of these have free tiers with limited functionality and paid tiers for real-time, filtered flow. If you're serious about incorporating flow into your trading, the investment is worth it.
Conclusion
Reading options flow isn't magic, and it's not a shortcut. It's a skill — one that takes time to develop and requires combining multiple data sources before it becomes genuinely useful.
But when you learn to read the tape, identify meaningful institutional activity, and align that information with clean price structure, you gain something most retail traders never have: context. You stop guessing about direction and start trading with a reason.
The traders who consistently find high-probability setups on SPX and index options aren't just watching price. They're watching what the big money is doing — and they're using that information to position themselves intelligently.
If you're serious about developing this skill and want daily trade setups built on exactly this kind of analysis, learn more at blueville.capital.